Balance Sheet
Balance sheet or financial statements is a statement that shows the value of a company’s assets and its debts.
This is prepared by accountants to represent the financial situation of the company.
The balance sheet summarizes a business’s assets, liabilities, and shareholders ‘ equity. It is like a photograph; it captures the financial position of a company at a particular point in time. It shows the accounting equation in balance. A company’s assets must equal their liabilities plus shareholders’ equity. A standard company balance sheet has three parts: assets, liabilities, and ownership equity.
Balance Sheet Analysis
Concretely, it is a set of methods, techniques and calculation standards used to assess and quantify from a financial and economic point of view the masses of assets and liabilities of an institution to profit.
The “balance sheet analysis” requires the re-evaluation of accounting data already entered in the balance sheet, by appealing to tax rules and general accounting rules. Among the other purposes of the balance sheet analysis are also the estimation of the company’s assets, the assessment of its solvency and the evaluation of its debt capacity as well as its ability to withstand economic or financial difficulties to come up.
Read also: Accounting Formulas | Definition, Calculation and Utility
Formula
Total Assets = Liabilities + Owner’s Equity
Liabilities = An obligation, debt, or responsibility owed to someone. It is a claim on the asset of the company by other firms, banks, or people.
Owner’s Equity = It is s money contribution done by a shareholder of a company for an ownership stake.
Total Asset = a total asset of a company including equity and liabilities, i.e., asset owe by company and money against the same has to repay back. Items of ownership convertible into cash; total resources of a person or business, as cash, notes and accounts receivable; securities and accounts receivable, securities, inventories, goodwill, fixtures, machinery, or real estate (as opposed to liabilities).
Example
| Assets (current) | Liabilities and Owners’ Equity | |||
|---|---|---|---|---|
| Cash | $6,600 | Liabilities | ||
| Accounts Receivable | $6,200 | Notes Payable | $5,000 | |
| Assets (fixed) | Accounts Payable | $25,000 | ||
| Tools and equipment | $25,000 | Total liabilities | $30,000 | |
| Owners’ equity | ||||
| Capital Stock | $7,000 | |||
| Retained Earnings | $800 | |||
| Total owners’ equity | $7,800 | |||
| Total | $37,800 | Total | $37,800 | |
Structure Balance Sheet
What information should be included in the balance sheet?
If applicable to the business, summary values for the following items should be included in the balance sheet: Assets are all the things the business owns. This will include property, tools, vehicles, furniture, machinery, and so on.
Assets (What the company owns)
Current assets
- Accounts receivable
- Cash and cash equivalents
- Inventories
- Cash at bank, Petty Cash, Cash On Hand
- Prepaid expenses for future services that will be used within a year
- Revenue Earned In Arrears (Accrued Revenue) for services done but not yet received for the year
- Loan To (Less than one financial period)
Non-current assets (Fixed assets)
- Property, plant and equipment
- Investment property, such as real estate held for investment purposes
- Intangible assets, such as patents, copyrights and goodwill
- Financial assets (excluding investments accounted for using the equity method, accounts receivables, and cash and cash equivalents), such as notes receivables
- Investments accounted for using the equity method
- Biological assets, which are living plants or animals. Bearer biological assets are plants or animals which bear agricultural produce for harvest, such as apple trees grown to produce apples and sheep raised to produce wool.[16]
- Loan To (More than one financial period)
Liabilities (What the company ows)
- Accounts payable
- Provisions for warranties or court decisions (contingent liabilities that are both probable and measurable)
- Financial liabilities (excluding provisions and accounts payables), such as promissory notes and corporate bonds
- Liabilities and assets for current tax
- Deferred tax liabilities and deferred tax assets
- Unearned revenue for services paid for by customers but not yet provided
- Interests on loan stock
Creditors equity: the proportion of assets that an organization is financing with credit extended to it by creditors. A high ratio of liabilities to assets implies that a business is maintaining a low equity level, thereby using creditors to enhance its return on equity
Equity / capital (Shareholder’s equity)
The net assets shown by the balance sheet equals the third part of the balance sheet, which is known as the shareholders’ equity. It comprises:
- Issued capital and reserves attributable to equity holders of the parent company (controlling interest)
- Non-controlling interest in equity
Formally, shareholders’ equity is part of the company’s liabilities: they are funds “owing” to shareholders (after payment of all other liabilities); usually, however, “liabilities” is used in the more restrictive sense of liabilities excluding shareholders’ equity. The balance of assets and liabilities (including shareholders’ equity) is not a coincidence. Records of the values of each account in the balance sheet are maintained using a system of accounting known as double-entry bookkeeping. In this sense, shareholders’ equity by construction must equal assets minus liabilities, and thus the shareholders’ equity is considered to be a residual.
Regarding the items in equity section, the following disclosures are required:
- Numbers of shares authorized, issued and fully paid, and issued but not fully paid
- Par value of shares
- Reconciliation of shares outstanding at the beginning and the end of the period
- Description of rights, preferences, and restrictions of shares
- Treasury shares, including shares held by subsidiaries and associates
- Shares reserved for issuance under options and contracts
- A description of the nature and purpose of each reserve within owners’ equity
Balance Sheet Template
Example 1
| [Company Name] | Balance Sheet | ||||
| Address: 123 Street Avenue, Cityville, State, 12333 | |||||
| Date Created: | Date Issued: | ||||
| 11 Jan, 2020 | 11 Jan, 2020 | ||||
| Pro Forma Balance Sheet | |||||
| Assets | Year 1 | Year 2 | Year 3 | ||
| Current Assets | |||||
| Cash | $78 000,00 | $36 000,00 | $78 000,00 | ||
| Accounts Receivable | $36 000,00 | $45 000,00 | $36 000,00 | ||
| Other Current Assets | $0,00 | $0,00 | $0,00 | ||
| Total Current Assets | $114 000,00 | $81 000,00 | $114 000,00 | ||
| Fixed Assets | |||||
| Property, Plant, and Equipment | $36 000,00 | $36 000,00 | $36 000,00 | ||
| Accumulated Depreciation | $36 000,00 | $36 000,00 | $36 000,00 | ||
| Total Fixed Assets | $0,00 | $0,00 | $0,00 | ||
| Total Assets | $114 000,00 | $81 000,00 | $114 000,00 | ||
| Liabilities and Equity | Year 1 | Year 2 | Year 3 | ||
| Current Liabilities | |||||
| Accounts Payable | $1 800,00 | $1 800,00 | $1 800,00 | ||
| Credit Cards | $1 800,00 | $1 800,00 | $1 800,00 | ||
| Customer Credit | $1 800,00 | $1 800,00 | $1 800,00 | ||
| Taxes Payable | $1 800,00 | $1 800,00 | $1 800,00 | ||
| Unearned Revenue | $1 800,00 | $1 800,00 | $1 800,00 | ||
| Other Current Liabilities | $1 800,00 | $1 800,00 | $1 800,00 | ||
| Total Current Liabilities | $10 800,00 | $10 800,00 | $10 800,00 | ||
| Long Term Liabilities | |||||
| Long Term Liabilities | $36 000,00 | $36 000,00 | $36 000,00 | ||
| Total Long Term Liabilities | $36 000,00 | $36 000,00 | $36 000,00 | ||
| Total Liabilities | $46 800,00 | $46 800,00 | $46 800,00 | ||
| Equity | |||||
| Net Profit (Loss) | $36 000,00 | $36 000,00 | $36 000,00 | ||
| Retained Earnings – Opening Balance | $36 000,00 | $36 000,00 | $36 000,00 | ||
| Owner’s Deposits (Withdrawals) | $36 000,00 | $36 000,00 | $36 000,00 | ||
| Total Equity | $108 000,00 | $108 000,00 | $108 000,00 | ||
| Total Liabilities and Equity | $154 800,00 | $154 800,00 | $154 800,00 | ||
Example 2
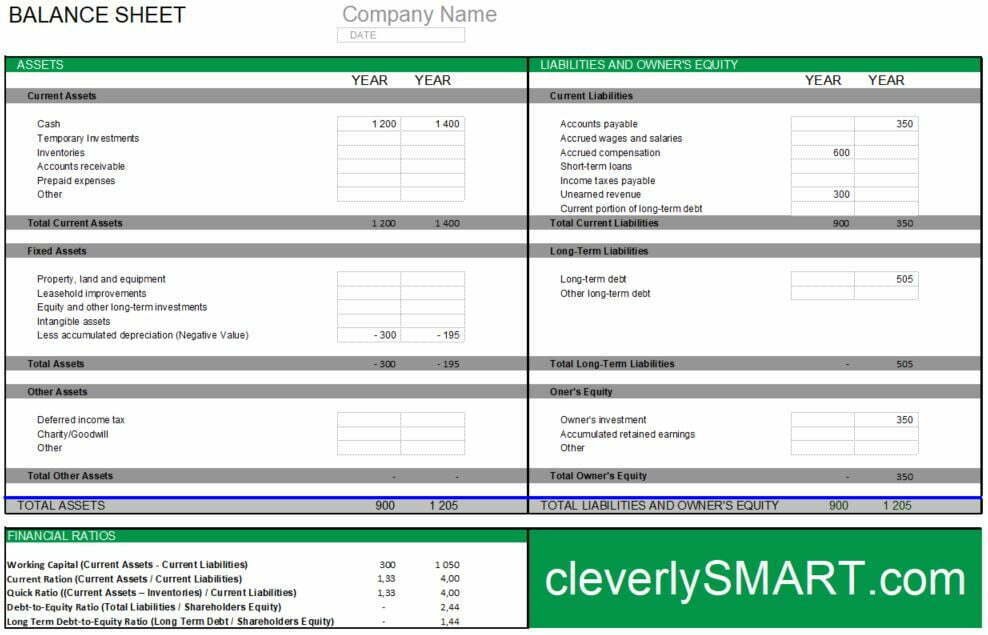
| BALANCE SHEET | Company Name | ||
| DATE | |||
| ASSETS | |||
| 2012 | 2013 | ||
| Current Assets | |||
| Cash | 1 200 | 1 400 | |
| Temporary Investments | |||
| Inventories | |||
| Accounts receivable | |||
| Prepaid expenses | |||
| Other | |||
| Total Current Assets | 1 200 | 1 400 | |
| Fixed Assets | |||
| Property, land and equipment | |||
| Leasehold improvements | |||
| Equity and other long-term investments | |||
| Intangible assets | |||
| Less accumulated depreciation (Negative Value) | – 300 | – 195 | |
| Total Assets | – 300 | – 195 | |
| Other Assets | |||
| Deferred income tax | |||
| Charity/Goodwill | |||
| Other | |||
| Total Other Assets | – | – | |
| TOTAL ASSETS | 900 | 1 205 | |
| LIABILITIES AND OWNER’S EQUITY | |||
| Current Liabilities | |||
| Accounts payable | 350 | ||
| Accrued wages and salaries | |||
| Accrued compensation | 600 | ||
| Short-term loans | |||
| Income taxes payable | |||
| Unearned revenue | 300 | ||
| Current portion of long-term debt | |||
| Total Current Liabilities | 900 | 350 | |
| Long-Term Liabilities | |||
| Long-term debt | |||
| Other long-term debt | |||
| Total Long-Term Liabilities | – | – | |
| Oner’s Equity | |||
| Owner’s investment | 350 | ||
| Accumulated retained earnings | |||
| Other | |||
| Total Owner’s Equity | – | 350 | |
| TOTAL LIABILITIES AND OWNER’S EQUITY | 900 | 700 | |
| FINANCIAL RATIOS | |||
| Working Capital (Current Assets – Current Liabilities) | 300 | 1 050 | |
| Current Ration (Current Assets / Current Liabilities) | 1,33 | 4,00 | |
| Quick Ratio ((Current Assets – Inventories) / Current Liabilities) | 1,33 | 4,00 | |
| Debt-to-Equity Ratio (Total Liabilities / Shareholders Equity) | – | 1,00 | |
| Long Term Debt-to-Equity Ratio (Long Term Debt / Shareholders Equity) | – | – | |
Non Profit Balance Sheet Template
| NON-PROFIT BALANCE SHEET TEMPLATE | |||||||
| [ NON-PROFIT NAME ] | BALANCE SHEET | ||||||
| ASSETS | [ YEAR ] | [ YEAR ] | LIABILITIES AND OWNER’S EQUITY | [ YEAR ] | [ YEAR ] | ||
| CURRENT ASSETS | CURRENT LIABILITIES | ||||||
| Cash | Program Services | ||||||
| Individual Donations | Administrative Costs | ||||||
| Grants | Rent | ||||||
| Investment Income | Office Supplies | ||||||
| Fundraising | Wages | ||||||
| TOTAL CURRENT ASSETS | $ – | $ – | Legal Fees | ||||
| FIXED (LONG-TERM) ASSETS | TOTAL CURRENT LIABILITIES | $ – | $ – | ||||
| Building/Headquarters | LONG-TERM LIABILITIES | ||||||
| Furniture/Fixtures | Bank Overdraft | ||||||
| Vehicles | Bank Loan | ||||||
| Equipment | Insurance | ||||||
| TOTAL FIXED ASSETS | $ – | $ – | TOTAL LONG-TERM LIABILITIES | $ – | $ – | ||
| OTHER ASSETS | OWNER’S EQUITY | ||||||
| Deferred Income Tax | Owner’s Investment | ||||||
| Other | Retained Earnings | ||||||
| TOTAL OTHER ASSETS | $ – | $ – | Other | ||||
| TOTAL OWNER’S EQUITY | $ – | $ – | |||||
| TOTAL ASSETS | $ – | $ – | |||||
| TOTAL LIABILITIES AND OWNER’S EQUITY | $ – | $ – | |||||
| COMMON FINANCIAL RATIO | [ YEAR ] | [ YEAR ] | |||||
| Debt Ratio (Total Liabilities / Total Assets) | |||||||
| Current Ratio (Current Assets / Current Liabilities) | |||||||
| Working Capital (Current Assets – Current Liabilities) | $ – | $ – | |||||
| Assets-to-Equity Ratio (Total Assets / Owner’s Equity) | |||||||
| Debt-to-Equity Ratio (Total Liabilities / Owner’s Equity) | |||||||
Sources: Consultant4Companies, Investopedia, Corporate Finance Institute, Wikipedia, FreshBooks


